Showing posts with label NDX. Show all posts

Thursday, October 27, 2011

NDX - Daily Market Thought 28102011 - Again 2412

See the latest  CHARTS  here  if you area member NON-members CLICK HERE to JOIN 
Click to zoom in.


Share/Bookmark

Sunday, September 18, 2011

NDX100 - Triangle Formation - Trg 2395

I`m not bullish indices but i can`t ignore clear pattern just because is bullish, and alert potential more upside short-term.
NDX close last friday near resistance [2307,2328] above 2365. NDX target triangle 2395 follow this scenario above 2228. AAPL have the same pattern and target 430.
Click to zoom in. Good luck folks


Share/Bookmark

Friday, July 22, 2011

NDX - Daily Megaphone Formation 23/07/2011

Click to zoom in.


Share/Bookmark

Saturday, May 7, 2011

NDX Daily Market Thought 09052011

Click to zoom in. Good Luck folks have a nice weekend.


Share/Bookmark

Thursday, January 20, 2011

Quick Update on the NDX Monthly chart Price Confluence 19/01/2011

I wanted to share another “Chart Art”
Why ndx reversal  last session?
Because have between 2330 and 2341 price confluence.
It’s not magic, just one more variable to consider for potential price confluences.
I suspect if ndx close monthly above 2341 next area [2536,2593] but remember DIV_PRO alert potential top near and for now first test confluence area worked.
Eyes monthly if close below 2239.23´.
I would like to create a better place
Help to suport this page. Many hours working last weeks folks.
If you have found the information on this blog last weeks or months that beneft you and wish to keep in going, contribute as you deem worthy.
I would like to create a better place but it depends on your suport.
If you have any proposal can call me: followmarkettrend@gmail.com
Click to zoom in. Good luck and have a great week.
 

Share/Bookmark

Sunday, January 9, 2011

NDX - Daily Market Thought 09012011 - Target fill and achieved

Last report 16 November 2010  I thought this:
Trend Bullish all time frames
Bullish head shoulders target underway 2142 .
Above 2022 Expect target between range [2142,2150] possible extension 2191.
Big level 2282 possible if spx test 1220 high of the year."
Can see all thought ndx HERE
Target fill last friday and achieved.
Next lebel sitting 2395 but need to break 2282 at weekly close to win momentum.
Potential reversal ndx need to close daily below 2234 to test [2190,2200] possible extension to 2150.
Click to zoom in.


Share/Bookmark

Saturday, October 16, 2010

NDX - Daily Market Thought - Target Underway

Trend Bullish all time frames
Bullish head shoulders target underway 2142 .
Above 2022 Expect target between range [2142,2150] possible extension 2191.
Big level 2282 possible if spx test 1220 high of the year.Click to zoom in.


Share/Bookmark

Sunday, September 19, 2010

NDX Daily Market Thought - Key Levels

Click to zoom in.

Share/Bookmark

Wednesday, September 15, 2010

NDX - Daily Market Thought - Next Resistance Area

Click to zoom in.


Share/Bookmark

Sunday, August 22, 2010

NDX - 60 minutes chart 22082010

CLick to zoom in.


Share/Bookmark

Saturday, July 10, 2010

NDX - Weekly Market Thought 10072010

Broke two weeks ago ascendent trend at 1810. That fact is bearish and below 1860 weekly chart we will follow a bearish view.
Close this week at 1815 and test trend line that had broken two weeks ago.
Next week still alert if market can`t stay long time above first 1815 minor resitance and above 1860 major resistance short-term .
Below 1860 weekly chart have the same target that i mention last weeks, expect test range [1656,1680].
MACD indicator neutral area if hold next week above 1656 will suggests that a temporary bottom is in place.
Hold above 1656 risk profit/loss give us some appetite to long positions with a stop 1628 daily chart ( close below) or 1580 weekly chart ( close below) depend of your profile. Close weekly below 1628 risk more damage target 1450 next suport area.
Beas:
- Bearish view short-term below 1860 weekly chart
- Bullish view medium and long term above 1628 weekly chart
Resistence: 1820, 1861 and 1940.
Suport: 1628, range [1656,1680] and 1716.
More thought index here and about forex here
Click to zoom in. Good luck folks.
NDX - Weekly Chart

Share/Bookmark

Tuesday, July 6, 2010

NDX - Weekly Market Thought 05072010

Broke last week ascendent trend at 1810. That fact is bearish  and below 1860 weekly chart we will follow a bearish view.
Below 1860 weekly chart have the same target that i mention last weeks, expect test range [1656,1680].
MACD indicator neutral area if hold next week above 1656 and most important above 1628 will suggests that a temporary bottom is in place. Hold above 1628 risk profit/loss give us some appetite to long positions with a stop 1628 daily chart ( close below) or 1580 weekly chart ( close below) depend of your profile.
Close weekly below 1628 risk more damage target 1450 next suport area.
Resistence: 1820, 1861 and 1940 Suport: 1716 and range [1656,1680]
More thoughts indexes  and more thoughts forex.

Click to zoom in. Good luck folks.
NDX - Weekly Chart

Share/Bookmark

Saturday, June 12, 2010

NDX - Weekly Market Thought 14062010

Hold one more week ascendant trendline and that fact is bullish for now, but below 1900 i`ll follow bearish view, follow/check MACD indicator.
Can be a bullish HS, but this is not the moment to follow that scenario.
Ascendant trend line next week number 1800.14.
Natural target for this moviment ( need close below trend ) > Test range [1656,1680].
Breakout(close) below 1779 market win momentum downside. Close weekly below 1656 expect 1450
First resistance 1900 area ( Remeber week Breakout need to close weekly above )
Enjoy your weekend. Next thought soon. Click to zoom in. Good luck folks.


Share/Bookmark

Saturday, June 5, 2010

NDX Weekly Market Tought 07062010

Waiting the same target. Test this week first resistance area around 1900.
Hold for now ascendant trend line next week number 1797.

Natural target for this moviment >> Test range [1656,1680]
 Click to zoom in. Good luck folks.


Share/Bookmark

Saturday, May 22, 2010

NDX100 Weekly Market Thought 25052010

Hold for now ascendant trend line next week number 1789.
Natural target for this moviment >> Test range [1656,1680]
Breakout(close) below 1779 market win momentum downside
Close weekly below 1656 expect 1450
Upside first resistance 1900 area
Click to zoom in. Enjoy your weekend


Share/Bookmark

Tuesday, April 27, 2010

$NDX Daily Market Thought 28042010

Click to zoom in. Good luck folks.


Share/Bookmark

Thursday, April 22, 2010

NDX - Market Thought 230402010

Click to zoom in. Good luck Folks.


Share/Bookmark

Tuesday, March 23, 2010

NDX - DAILY MARKET THOUGHT 24032010

Click to zoom in. Good Luck


Share/Bookmark

Monday, March 22, 2010

US – INTRADAY MARKET THOUGHT 22032010

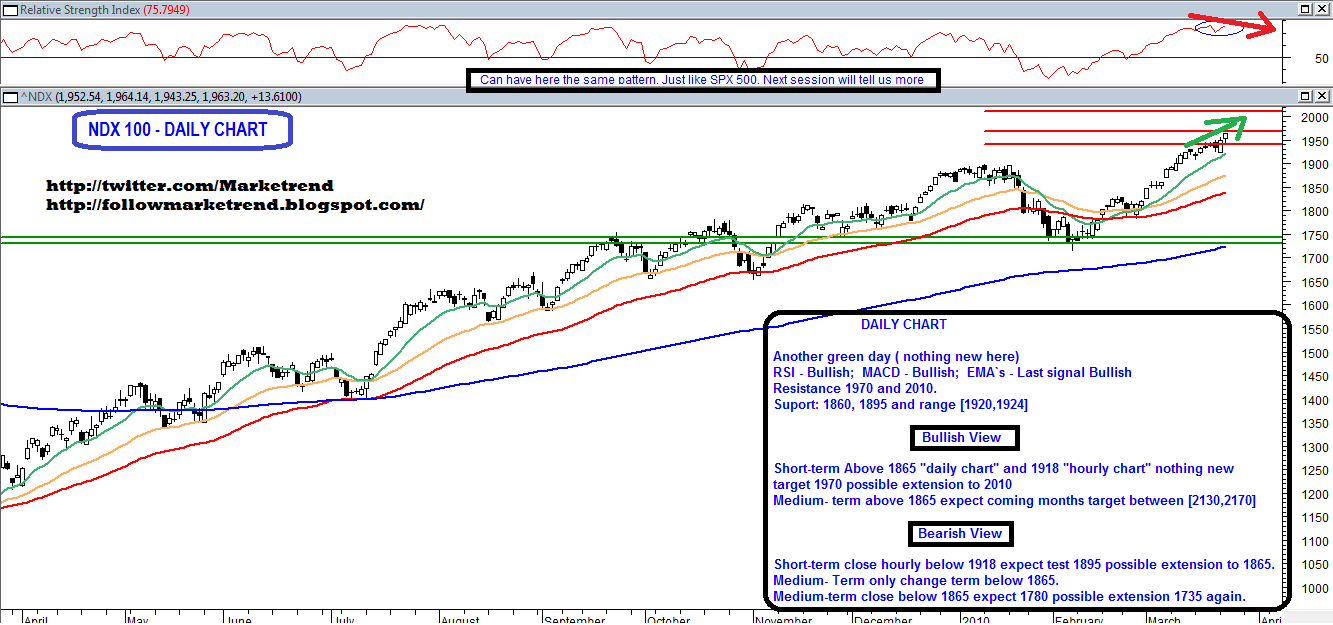
Open today near suport area SPX500 range [1150,1156]= ½ -> 1153 open 1054 and NDX100 range [1920,1926]= ½ ->1923 open today 1926 expect new high target short term spx > 1170 expect 1175 and NDX100 above 1952 expect 1970 ( Next resistance area. Last update SPX500 daily chart here http://bit.ly/9zj4Ky and NDX daily chart here http://bit.ly/bFS9Ni .

Put/call at the high of the session for now 0.91 open 0.73. http://bit.ly/ULoZ2 and vix up 1% -> 17.14, open at high of the session (big gap) around 18.30.

Possible bearish divergence SPX500 daily chart underway, but remember first condition we need new highs above last week ->> Pattern bearish example here http://bit.ly/85tESC .

Good luck. New chart DAX after close europe.


Share/Bookmark

Sunday, March 21, 2010

NDX - DAILY MARKET REPORT 22032010

Click to zoom in. Cheers!!


Share/Bookmark