
Still valid potential bearish divergence daily chart price vc indicator.
Daily nothing change 1271 is key level. The 60 minutes alert last thought "above 1298 and more important above 1294 buyers control.".
Today low 1294.83 market reversal to closer near the highs 1307.10.
 Commentary Daily chart SPX500 EOD - Swing trader
Above 1271 trend remain bullish target range [1297,1324] possible minor or major top next months.
Still valid potential bearish divergence daily chart price vc indicator.
Next resistance 1310,1324 and 1350.

Area Daily chart - Position
Suport - 1220, 1235, [1259,1262] and 1271
Resistance – 1310, 1324, 1350;
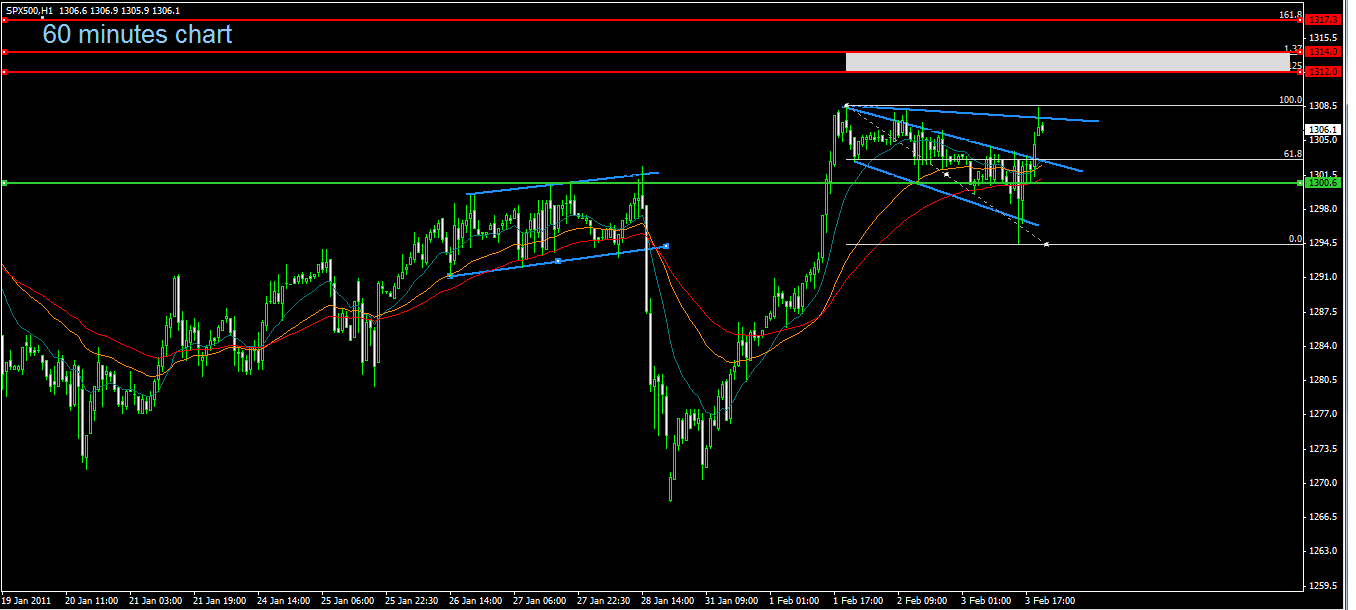
Commentary 60 minutes chart SPX500 EOD - Day trader
Above 1300 and more important above 1298 buyers control.
If close 60 minutes below 1298 risk appetite test today lows (1294.83) and reversal short-term.
Breakout today high good change test first 1310 and if break next area [1312,1314] and 1317. Area 60 minutes Chart – Daytrading
 Suport - [1259,1262],1271,1281,1287,1294, 1298 and 1300;
Resistance – [1307,1310] next [1312,1314] and 1317
Economic Data/Events week 31-04 /02
 Friday
- Monthly Payrolls report with the Unemployment rate.
Click to zoom in.
Hey good to see you still going strong.
ReplyDeleteHi buddy.
ReplyDeleteNice to see you here.
I seeyour last calls very good performance.
Have a good weekend.